
Web Scraper + Text Analysis + Sentiment Analysis
Web Scraper
There are two primary sources of codes (both written in Python): twitterscraper by Ahmet Taspinar and zhihu_spider by
Liu Ruoyu. Codes can be downloaded from Github through the links.
Text Analysis
Code in this part is written in R.
Build Corpus
install.packages("tm")
install.packages("SnowballC")
library("tm")
library("SnowballC")
Clean The Corpus
Several things need to be done before we can run the analysis:
- Converts all text to lower case
- Removes Punctuation
- Removes common english words
- Transforms to root words
- Takes out https (since these are tweets there are a bunch of https)
- Takes out spaces left by removing previous misc.
Using Tweets as an example example, the code should look like:
TweetCorpus <- TweetCorpus %>%
  tm_map(removeNumbers) %>%
  tm_map(removePunctuation) %>%
  tm_map(stripWhitespace)
TweetCorpus <- tm_map(TweetCorpus, content_transformer(tolower))
TweetCorpus <- tm_map(TweetCorpus, removeWords, stopwords("english"))
TweetCorpus <- tm_map(TweetCorpus, stemDocument)
removeURL <- function (x) gsub('http[[:alnum:]]*','', x)
TweetCorpus <- tm_map(TweetCorpus, content_transformer(removeURL))
TweetCorpus <- tm_map (TweetCorpus, stripWhitespace)
inspect (TweetCorpus[1:5])
Make Term Document Matrix
Tweetdm <- TermDocumentMatrix(TweetCorpus)
Tweetdm <- as.matrix(Tweetdm)
Tweetdm[1:10, 1:20]
See freq of words, then exclude to only words showing more than 7 times
eachword <- rowSums(Tweetdm)
eachword
subofeach <-subset(eachword, eachword>=5)
subofeach
#barplot with words typed vertically
barplot (subofeach, las=2)
Generate a Wordcloud
R packages:
install.packages(wordcloud)
install.packages(RColorBrewer)
library(RColorBrewer)
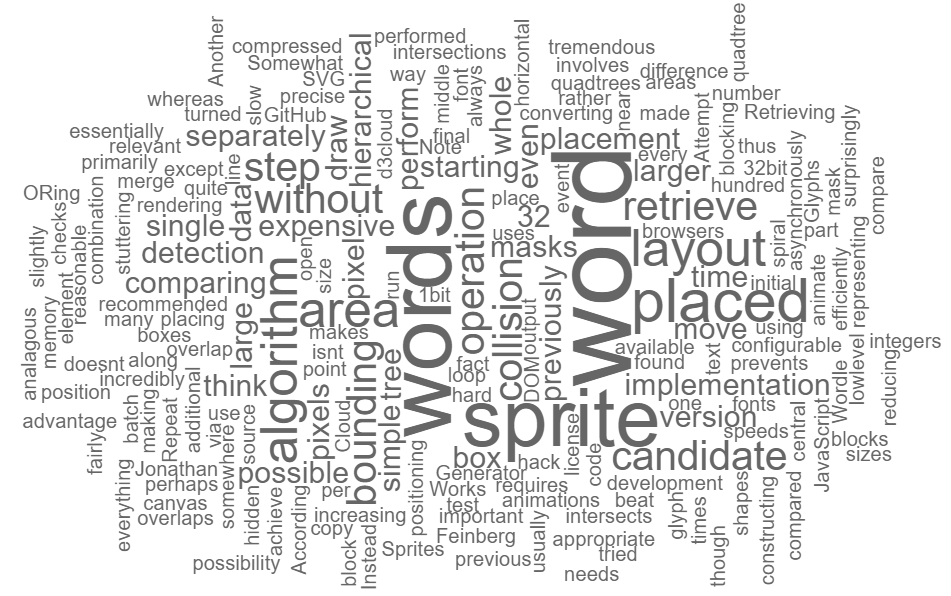
library(wordcloud)TweetCloud <- sort(rowSums(Tweetdm), decreasing=TRUE)
set.seed (123)
wordcloud (words=names(subofeach),
freq=subofeach,
max.words=30,
colors=brewer.pal(8, "Dark2"))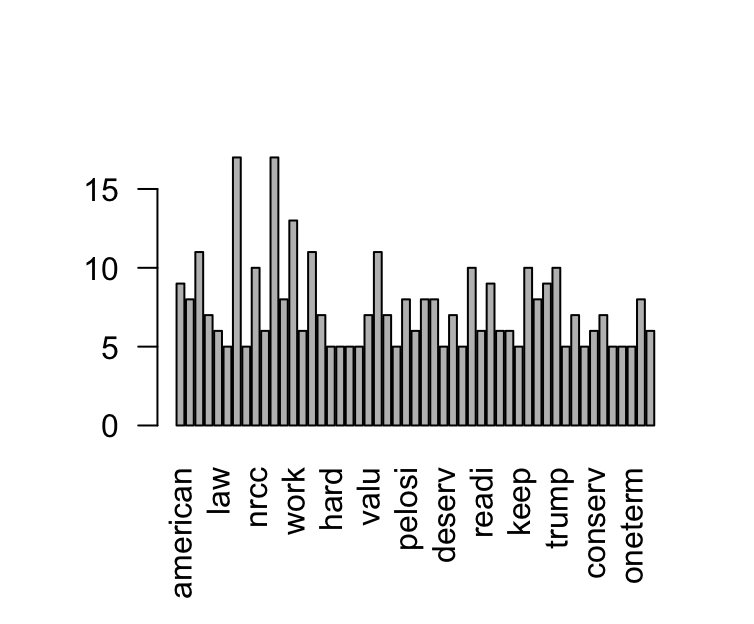 The other way of making a word cloud is using the code chartjs-chart-wordcloud by Samuel Gratzl. The code is written in
 Typescript and Javascript.
Sentiment Analysis
Sentiment analysis is the use of natural language processing, text analysis, computational linguistics, and biometrics to systematically identify, extract, quantify, and study affective states and subjective information.
In R, we can use package syuzhet:
install.packages(syuzhet)
library(syuzhet)
scores <- get_nrc_sentiment(Slotkinonly)
head (scores)

Slotkinonly[4]
get_nrc_sentiment('thank')
get_nrc_sentiment('president')

# using original tweets, run the sentiment analysis and plot it on a bar chart.
barplot (colSums(scores),
         las=2,
         col=rainbow(10),
         ylab="counts",
         main="Sentiment Score for Paul Junge Tweets")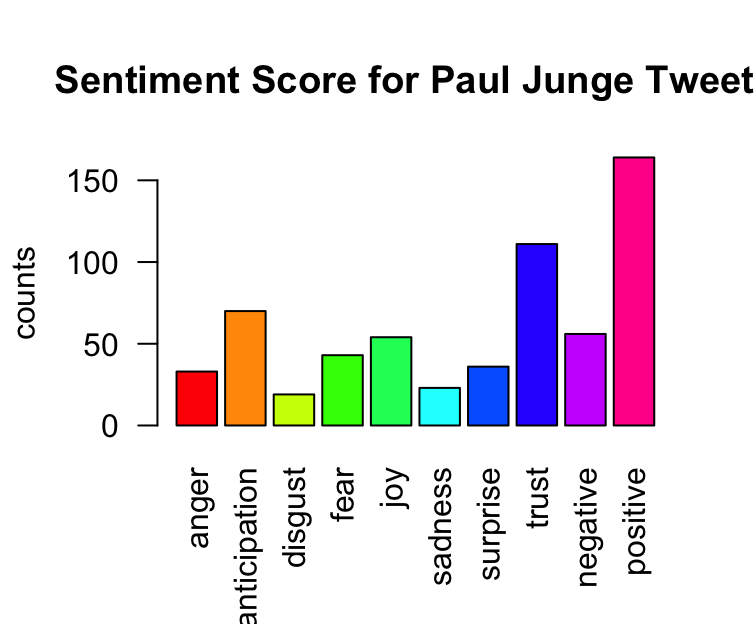
However, there is a good package in Python aviliable on Github. The package is called pattern, from Computational Linguistics Research Group.